In today's digital landscape, ensuring the security of online communications is paramount, and SSL certificates play a crucial role in this process. Monitoring these certificates to prevent unexpected expirations is essential for maintaining uninterrupted service and trust. This HowTo guide provides a step-by-step approach to setting up monitoring for SSL certificates, ensuring you receive timely alerts before they expire. By utilizing powerful tools such as Blackbox Exporter, Alertmanager, Prometheus and Grafana, you can automate the notification process, allowing for proactive certificate management. This guide simplifies the setup process, making it accessible for both beginners and experienced professionals. With these instructions, you can enhance your security posture and avoid the risks associated with expired SSL certificates. How to receive alert messages from Grafana in your Matrix chat may also be interesting - I already covered that one here.
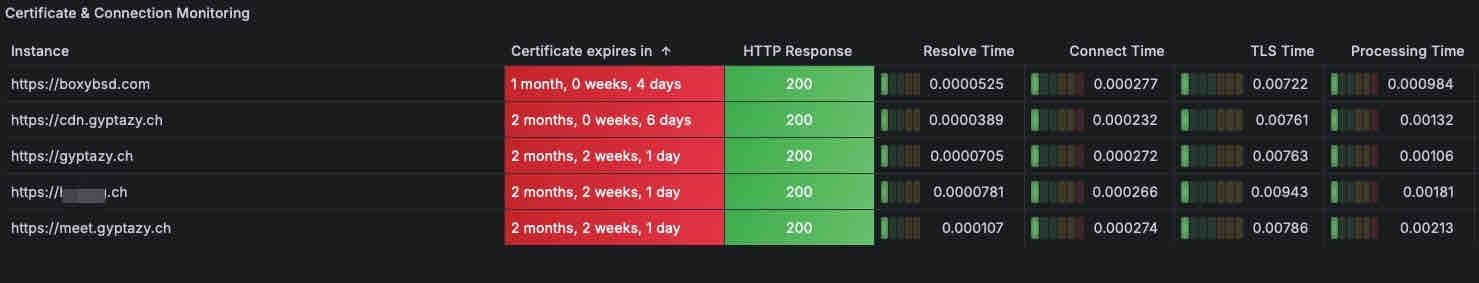
Screenshot
 |
General
This howto expects you to have an already working installation of Grafana and Prometheus running and will guide you through the process for setting up the SSL certificate monitoring on Debian/Ubuntu based systems and FreeBSD. Therefore, please take a look which steps are needed for you operating system because there might be some smaller differences.
Installation
Since the Blackbox exporter is already packaged in Debian, Ubuntu and FreeBSD, it can simply be installed by using the system's repository. Running the following code snippet on your system will install all needed things:
# Debian or Ubuntu
apt-get install prometheus-blackbox-exporter
# FreeBSD
pkg install blackbox_exporter
Configuration
After installing the packages, the configuration can be adjusted. It only needs to configure two parts - the blackbox.yml and adjusting the scrape points in the prometheus.yml configuration file. We start with the blackbox configuration and add simply this content to the blackbox.yml file. This file is located in a different place, depending on your operating system.
* FreeBSD: /usr/local/etc/prometheus-blackbox-exporter/blackbox.yml
* Debian/Ubuntu: /etc/prometheus/blackbox.yaml
Code:
modules:
http_2xx:
prober: http
http:
tls_config:
insecure_skip_verify: true
Afterwards, the scrape point can be defined in the prometheus.yml config file. Also this one is located in a different place, depending on your operating system.
* FreeBSD: /usr/local/etc/prometheus-blackbox-exporter/prometheus.yml
* Debian/Ubuntu: /etc/prometheus/prometheus.yaml
Code:
- job_name: 'blackbox'
metrics_path: /probe
params:
module: [http_2xx]
static_configs:
- targets:
- https://gyptazy.ch
- https://cdn.gyptazy.ch
- https://boxybsd.com
- https://manpageblog.org
relabel_configs:
- source_labels: [__address__]
target_label: __param_target
- source_labels: [__param_target]
target_label: instance
- target_label: __address__
replacement: 127.0.0.1:9115
The services can now be started and should also be started automatically at boot time. This will be started and enabled by running the following commands:
Debian/Ubuntu:
systemctl enable prometheus-blackbox-exporter
systemctl start prometheus-blackbox-exporter
FreeBSD:
service prometheus_blackbox_exporter enable
service prometheus_blackbox_exporter start
Grafana
The last part is about the visualization in Grafana. With all the steps above we are already gathering all metrics but we also want to see them in a human readable way. Therefore, a nice dashboard is needed - luckily there is already a dashboard present. You can simply use the dashboard 13230 (certificate monitor) in your Grafana UI and simply select the Prometheus data source. After a few minutes you can see the metrics in your new dashboard.
Conclusion
Grafana and Prometheus setups are incredibly versatile, offering more than just monitoring, validating, and visualizing performance metrics. They can also serve as a robust monitoring system, comparable to software stacks like Zabbix or Icinga2. However, managing multiple components across different systems often results in increased complexity and additional effort. This can be time-consuming and resource-intensive. By consolidating your monitoring needs into a single system with Grafana and Prometheus, you can streamline operations and reduce maintenance overhead. This approach not only saves time but also simplifies the overall management of your monitoring infrastructure.